# A Date

<table id="bkmrk-titel-verf%C3%BCgbar-widg" style="border-collapse:collapse;width:100%;height:388.5px;"><colgroup><col style="width:14.555%;"></col><col style="width:23.7048%;"></col><col style="width:61.7402%;"></col></colgroup> <thead> <tr style="height:29.7969px;"> <td style="height:29.7969px;">Titre</td> <td style="height:29.7969px;">Widget</td> <td style="height:29.7969px;">Description du widget</td> </tr> </thead> <tbody> <tr style="height:358.703px;"> <td style="height:358.703px;">A Date</td> <td style="height:358.703px;"><div drawio-diagram="1955"><img src="https://fr.wiki.dedesales.de/uploads/images/gallery/2026-09/ycL5UuSNgVTToc4b-xkntexuel9at0jqt-drawing-9-1754902805.png" alt="xKNtexuEl9aT0jQt-drawing-9-1754902805.png"/></div>

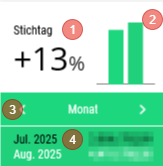
 </td> <td style="height:358.703px;">1. Modification du chiffre d'affaires en %
2. Modification du chiffre d'affaires graphique
3. Changement des variantes d'affichage "Mois" | "Mois / Année précédente" | "Année". <span class="wpaicg-chat-message"></span>
    
    La variante choisie en dernier est enregistrée et présélectionnée au prochain démarrage.
4. Affichage des chiffres concrets sur la base du choix de 3.
 
Disponible :

- Tableau de bord de la page d'accueil
- Fiche client
 
Clic :

- Passe en vue détaillée
 
Coloration du widget :

- rouge : chiffre d'affaires négatif
- vert : chiffre d'affaires positif
 
Les données concernent uniquement les clients pris en charge.

 </td> </tr> </tbody> </table>

### Généralités

#### Menu kebab ([![image.png](https://fr.wiki.dedesales.de/uploads/images/gallery/2026-09/Zp3WWTLsIQQE7qkW-hpximage.png)](https://wiki.dedesales.de/uploads/images/gallery/2025-02/hpximage.png))


<table id="bkmrk-typ-men%C3%BCpunkt-erl%C3%A4ut" style="border-collapse:collapse;width:100%;height:257.953px;"><colgroup><col style="width:5.24434%;"></col><col style="width:31.2277%;"></col><col style="width:63.528%;"></col></colgroup> <thead> <tr style="height:29.7969px;"> <td style="height:29.7969px;">Type</td> <td style="height:29.7969px;">Point de menu</td> <td style="height:29.7969px;">Explication</td> </tr> </thead> <tbody> <tr style="height:29.7969px;"> <td style="height:29.7969px;">![Un seul élément actif est possible.](https://fr.wiki.dedesales.de/uploads/images/gallery/2026-09/VVilFrk0fhot186q-jbemwch2ontcwalv-r6pimage.png)

 </td> <td style="height:29.7969px;">Année calendaire</td> <td style="height:29.7969px;">  
</td> </tr> <tr style="height:29.7969px;"> <td style="height:29.7969px;">![Un seul élément actif est possible.](https://fr.wiki.dedesales.de/uploads/images/gallery/2026-09/VVilFrk0fhot186q-jbemwch2ontcwalv-r6pimage.png)</td> <td style="height:29.7969px;">Exercice</td> <td style="height:29.7969px;">Visible uniquement si Exercice &lt;&gt; Année calendaire</td> </tr> <tr style="height:31.375px;"> <td style="height:31.375px;">![Un seul élément actif est possible.](https://fr.wiki.dedesales.de/uploads/images/gallery/2026-09/VVilFrk0fhot186q-jbemwch2ontcwalv-r6pimage.png)

 </td> <td style="height:31.375px;">A Date</td> <td style="height:31.375px;">  
</td> </tr> <tr> <td>  
</td> <td>------------------------------------ </td> <td>  
</td> </tr> <tr style="height:29.7969px;"> <td style="height:29.7969px;">  
</td> <td style="height:29.7969px;">Hiérarchie des produits</td> <td style="height:29.7969px;">  
</td> </tr> <tr> <td> </td> <td>------------------------------------ </td> <td>  
</td> </tr> <tr style="height:35.7969px;"> <td style="height:35.7969px;"> </td> <td style="height:35.7969px;">Exporter</td> <td style="height:35.7969px;">  
</td> </tr> </tbody> </table>


#### En-tête

<div drawio-diagram="1956"><img src="https://fr.wiki.dedesales.de/uploads/images/gallery/2026-09/3pL6SLAsU8aKplr4-6xco1e3lswgr0bea-drawing-9-1754902949.png" alt="6xco1E3lSWGr0bea-drawing-9-1754902949.png"/></div>

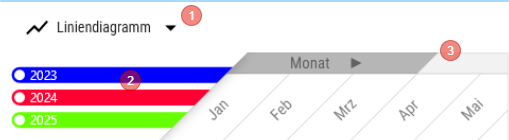
1. L'affichage du diagramme peut être basculé entre Diagramme linéaire et Diagramme à barres
2. Les dégradés de couleurs sont contrôlés via le backend
3. Lorsque le diagramme est ouvert et que tous les intervalles de temps ne peuvent pas être affichés, l'affichage défile vers la gauche pour rendre visible l'intervalle de temps actuel (par exemple, le mois). En faisant défiler, d'autres intervalles de temps peuvent être rendus visibles
 
#### Remarques 2 générales

1. La ligne de somme du tableau est toujours affichée en bas de l'écran
2. L'échelle de l'axe Y est calculée dynamiquement et s'oriente sur la valeur la plus élevée des données à afficher
 
### Grille

<table id="bkmrk-click-swipe-ansichte" style="height:101px;width:100%;"> <thead> <tr> <td style="width:15.8522%;">Clic</td> <td style="width:53.3938%;">Glissement</td> <td style="width:30.754%;">Vues</td> </tr> </thead> <tbody> <tr> <td style="width:15.8522%;"> </td> <td style="width:53.3938%;">1. <div>Par glissement, on accède à la vue des documents avec un filtre préconfiguré.</div><div>  
    </div>
2. <div>Il y a donc 3 choix de glissement</div><div>Documents &lt;Année actuelle&gt;</div><div>Documents &lt;Année précédente&gt;  
    Documents &lt;Avant-année précédente&gt;</div>
 
 </td> <td style="width:30.754%;">1\. Tableau

 </td> </tr> </tbody> </table>

### Filtre

<div id="bkmrk-1.-im-filter-kann-de">1. Dans le filtre, la période d'évaluation (début et fin) peut être choisie.</div><div id="bkmrk-a.-der-auswertungsze" style="padding-left:40px;">a. La période d'évaluation peut durer au maximum 1 an.</div><div id="bkmrk-2.-der-filter-gilt-f">2. Le filtre s'applique aussi bien au diagramme qu'au tableau.</div><div id="bkmrk-3.-automatische-ausw">3. Sélection automatique de la période</div><div id="bkmrk-a.-enth%C3%A4lt-der-gew%C3%A4h" style="padding-left:40px;">a. Si la période choisie contient moins de 32 jours, la période correspond à "Jour"</div><div id="bkmrk-b.-enth%C3%A4lt-der-gew%C3%A4h" style="padding-left:40px;">b. Si la période choisie contient moins de 93 jours, la période correspond à "Semaine"</div><div id="bkmrk-c.-in-allen-anderen-" style="padding-left:40px;">c. Dans tous les autres cas, la période correspond à "Mois".</div>##### Présentation tabulaire

<table id="bkmrk-bezeichnung-sichtbar" style="border-collapse:collapse;width:100%;"><colgroup><col style="width:43.5042%;"></col><col style="width:56.4958%;"></col></colgroup> <thead> <tr> <td>Désignation</td> <td>Explication</td> </tr> </thead> <tbody> <tr> <td>Période</td> <td> La période pour laquelle les données sont filtrées est affichée "Jour" | "Semaine" | "Mois"</td> </tr> <tr> <td><div>Colonnes annuelles</div> </td> <td><div><div>- Année calendaire à 4 chiffres
- Trois colonnes annuelles sont affichées. Au minimum autant que la période d'évaluation choisie individuellement en années.
 
 </div> </div> </td> </tr> <tr> <td>Colonnes de variation</td> <td>% de variation par rapport à la période de comparaison</td> </tr> </tbody> </table>

### Présentation du diagramme

<div id="bkmrk-1.-der-chart-zeigt-i">1. Le diagramme affiche toujours au maximum trois lignes/barres de valeurs.</div><div id="bkmrk-a.-jede-linie%2Fbalken">a. Chaque ligne/barre représente une année calendaire ou un exercice.</div><div id="bkmrk-aktuelles-jahr-%3D-far" style="padding-left:40px;">Année actuelle = dégradés de couleurs : Configuration de base \ Configuration \ Client-Chart-Couleur Année actuelle</div><div id="bkmrk-1-jahr-zur%C3%BCck-%3D-farb" style="padding-left:40px;">1 an en arrière = dégradés de couleurs : Configuration de base \ Configuration \ Client-Chart-Couleur Année précédente</div><div id="bkmrk-2-jahre-zur%C3%BCck-%3D-far" style="padding-left:40px;">2 ans en arrière = dégradés de couleurs : Configuration de base \ Configuration \ Client-Chart-Couleur il y a deux ans</div><div id="bkmrk-wird-durch-einen-ind">Si une période individuelle nécessite l'affichage de plus de trois années, seules les trois années les plus récentes sont affichées.</div><div id="bkmrk--6"></div>### Vue Hiérarchie des produits

<div id="bkmrk-1.-in-der-produkthie"><div>1. Dans la vue Hiérarchie des produits, les chiffres d'affaires sont affichés par niveau de la Hiérarchie des produits.</div><div style="padding-left:40px;">a. La colonne "Mois" est supprimée et remplacée par la Hiérarchie des produits.</div><div>2. Lorsqu'une ligne est sélectionnée dans la vue, le diagramme affiche les chiffres d'affaires de la Hiérarchie des produits choisie.</div><div style="padding-left:40px;">a. Le chiffre d'affaires affiché est calculé à partir de la hiérarchie choisie et des niveaux inférieurs.</div><div style="padding-left:40px;">b. Si aucune ligne n'est sélectionnée, le chiffre d'affaires total est affiché.</div><div>3. Les lignes derrière lesquelles se trouvent des produits sont marquées par une barre verte.</div><div>4. Glissement</div><div style="padding-left:40px;">a. Produits</div><div>5. Point triple</div><div style="padding-left:40px;">a. Sélection du mandant</div> </div>#### Produits

Liste les produits présents dans la Hiérarchie des produits et les niveaux inférieurs avec chiffre d'affaires et quantité vendue.

<table id="bkmrk-bezeichnung-sichtbar-1" style="height:345.141px;width:100%;"> <thead> <tr style="height:46.5938px;"> <td style="width:19.4279%;height:46.5938px;">Désignation</td> <td style="width:19.0703%;height:46.5938px;">Visible</td> <td style="width:8.10091%;height:46.5938px;">Tri</td> <td style="width:5.72507%;height:46.5938px;">Texte complet</td> <td style="width:47.6758%;height:46.5938px;">Explication</td> </tr> </thead> <tbody> <tr style="height:29.7969px;"> <td style="width:19.4279%;height:29.7969px;">Produit</td> <td style="width:19.0703%;height:29.7969px;">VisibleOnlyLandscape</td> <td style="width:8.10091%;height:29.7969px;">  
</td> <td style="width:5.72507%;height:29.7969px;">Oui</td> <td style="width:47.6758%;height:29.7969px;">  
</td> </tr> <tr style="height:29.7969px;"> <td style="width:19.4279%;height:29.7969px;">Désignation</td> <td style="width:19.0703%;height:29.7969px;">Visible</td> <td style="width:8.10091%;height:29.7969px;">ASC</td> <td style="width:5.72507%;height:29.7969px;">  
</td> <td style="width:47.6758%;height:29.7969px;">  
</td> </tr> <tr style="height:29.7969px;"> <td style="width:19.4279%;height:29.7969px;">Hiérarchie</td> <td style="width:19.0703%;height:29.7969px;">Hidden</td> <td style="width:8.10091%;height:29.7969px;">  
</td> <td style="width:5.72507%;height:29.7969px;">  
</td> <td style="width:47.6758%;height:29.7969px;">  
</td> </tr> <tr style="height:43.375px;"> <td style="width:19.4279%;height:43.375px;">Quantité &lt;Année actuelle&gt;</td> <td style="width:19.0703%;height:43.375px;">VisibleOnlyLandscape</td> <td style="width:8.10091%;height:43.375px;">  
</td> <td style="width:5.72507%;height:43.375px;">  
</td> <td style="width:47.6758%;height:43.375px;">  
</td> </tr> <tr style="height:46.5938px;"> <td style="width:19.4279%;height:46.5938px;">VENTES &lt;Année actuelle&gt;</td> <td style="width:19.0703%;height:46.5938px;">Visible</td> <td style="width:8.10091%;height:46.5938px;">  
</td> <td style="width:5.72507%;height:46.5938px;">  
</td> <td style="width:47.6758%;height:46.5938px;">  
</td> </tr> <tr style="height:29.7969px;"> <td style="width:19.4279%;height:29.7969px;">Quantité &lt;Année précédente&gt;</td> <td style="width:19.0703%;height:29.7969px;">VisibleOnlyLandscape</td> <td style="width:8.10091%;height:29.7969px;">  
</td> <td style="width:5.72507%;height:29.7969px;">  
</td> <td style="width:47.6758%;height:29.7969px;">  
</td> </tr> <tr style="height:29.7969px;"> <td style="width:19.4279%;height:29.7969px;">VENTES &lt;Année précédente&gt;</td> <td style="width:19.0703%;height:29.7969px;">Visible</td> <td style="width:8.10091%;height:29.7969px;">  
</td> <td style="width:5.72507%;height:29.7969px;">  
</td> <td style="width:47.6758%;height:29.7969px;">  
</td> </tr> <tr style="height:29.7969px;"> <td style="width:19.4279%;height:29.7969px;">Quantité &lt;Avant-année précédente&gt;</td> <td style="width:19.0703%;height:29.7969px;">VisibleOnlyLandscape</td> <td style="width:8.10091%;height:29.7969px;">  
</td> <td style="width:5.72507%;height:29.7969px;">  
</td> <td style="width:47.6758%;height:29.7969px;">  
</td> </tr> <tr style="height:29.7969px;"> <td style="width:19.4279%;height:29.7969px;">VENTES &lt;Avant-année précédente&gt;</td> <td style="width:19.0703%;height:29.7969px;">Visible</td> <td style="width:8.10091%;height:29.7969px;">  
</td> <td style="width:5.72507%;height:29.7969px;">  
</td> <td style="width:47.6758%;height:29.7969px;">  
</td> </tr> </tbody> </table>

### Exporter

Lors de l'exportation, un document Excel est créé. Le document Excel contient sur la feuille 1 (Nom : Diagramme) une capture d'écran du diagramme ainsi que les données pour la période d'évaluation.

Sur la feuille 2 (Nom : Données) un tableau avec les données correspondantes.

<div id="bkmrk--8"></div><details id="bkmrk-faq-wie-steuere-ich-"> <summary>FAQ</summary>

 </details><details id="bkmrk-release-ab-version-1"> <summary>Release</summary>

</details>